Brian Jing
12/26/23
IntroductionThe fundamental concept of data science is data; without data, there is no data science. Working with data is a prerequisite for starting your data science project, and in this blog, I will be covering three large steps in the process of data science that involve working with data, with examples using the R programming language.
Data CollectionThe first step is data collection. With data collection, you will need to collect data or find an already existing dataset meaningful to your project. For instance, if you are building a model to classify frogs as a specific type based on their physical traits, a suitable dataset for the project could have each unique frog as a separate row, and each trait for the frogs as a column. Your data should be accurate and relevant to the content of your project. These datasets typically come in the form of .csv files, which I will use throughout this blog.
*.csv stands for “comma-separated values, as data points on .csv files are usually separated by commas*
Kaggle is a great website for finding existing datasets and publishing datasets you create for others to use and spread your work. You can build datasets based on the vast array of information easily accessible on the Internet.
But what if you want to collect the data for your dataset yourself? There are two methods in which this is typically done:
Sample surveys typically involve taking samples of data from the entire group, as taking all the information from the entire population would be tedious, costly, and inefficient. However, you want to be sure that this data is as representative of the entire population as possible. You typically want to avoid two mistakes:
- Convenience sampling, which involves sampling only people who are convenient to reach.
- And voluntary response sampling, which allows people in the chosen sample to choose whether they would like to participate or not.
Both of these sampling techniques are susceptible to bias, as it would likely exclude a group of people who would respond differently, causing the over or underestimation of a certain group.
You also want to avoid phrasing questions in a way that might lead to bias as well - try to be as objective as possible, and also try to eliminate the presence of other variables that may interfere with the relationship of the explanatory and response variables that you are actually looking at, jeopardizing the relevance of the data. Taking a random sample of the whole population is ultimately the most accurate way to collect data representative of that population.
Experimenting, on the other hand, involves taking a group of experimental units or subjects, and assigning a treatment to individuals to measure the outcomes. In an experiment, you need:
- Random assignment of the treatment to different experimental units.
- Control groups to see the effects of other treatments compared to the main treatment. This may include having a placebo group, which receives no real treatment.
- To keep outside variables constant for all experimental units.
- To use enough experimental units.
- Using just a few experimental units is usually never enough.
For instance, you could assign some individuals to follow a certain diet to measure the outcomes of that diet on weight loss. You would need to randomly assign the diet to certain individuals in a population of around 100 individuals, have control groups with different diets, and you would need to keep their exercise and sleeping habits the same.
- An observational study may be used instead, which observes individuals and measures variables of interest, but does not attempt to influence the responses.
The next step is to log all the data you collect down and put it in an online format. As previously mentioned, the .csv file is a popular and efficient way of using this for data science, due to its compatibility with R and Python.
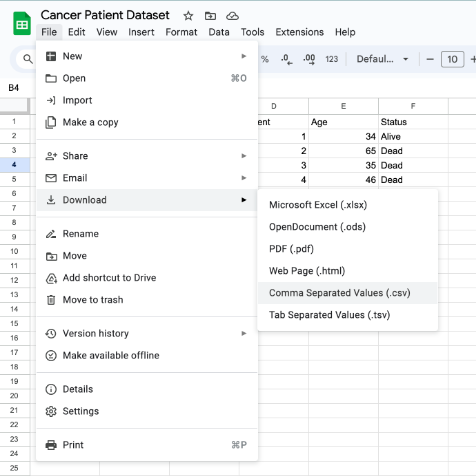
To create a .csv file, you can create a Google Sheets or Excel file, input your data points, with titles for your columns, and with rows as the people you sampled or your experimental units. You would then save the spreadsheet as a .csv file.
- With Google Sheets, you would click File → Download → CSV.
- With Excel, you would click File → Save As → CSV.
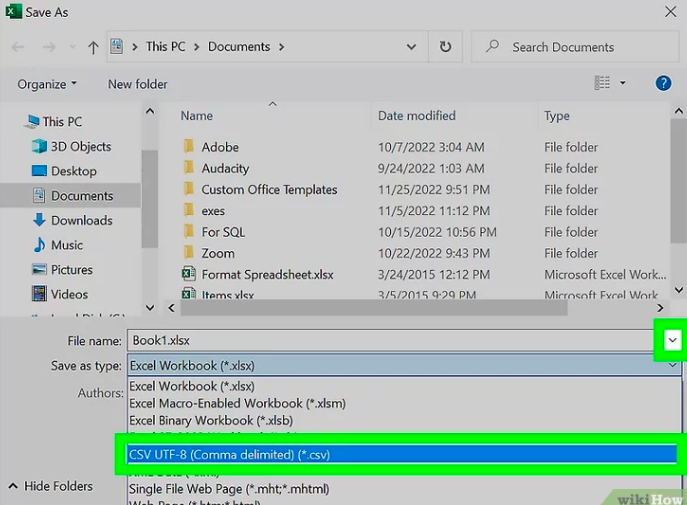
WikiHow
The next step in working with data is data preprocessing, which refers to the cleaning of data to a quality ready for data analysis. Usually, datasets aren’t perfect, and data should always be analyzed in context and with a grain of salt. Data preprocessing usually attempts to make a specific dataset more accurate for the project at hand; sometimes, it is not needed at all, but you must verify that before starting your data analysis.
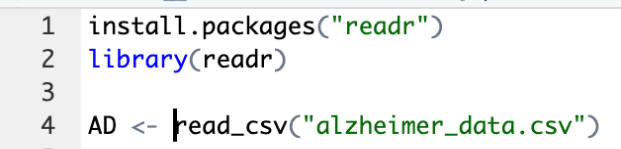
First, you need to read your .csv file with R using the read_csv(“filename.csv”) function on R using the readr package.
You will then have to go through the data, checking for inaccuracies and flaws in your data which may cause your data analysis to be misled. This typically involves looking for a variety of problems that may be different - ultimately, it is important to understand and preprocess your data in context. There are too many preprocessing techniques for me to go in-depth on, but two common things you can do to preprocess your data are listed below:
- Firstly, you must look for small, somewhat-obvious errors in your dataset that may be otherwise overlooked. Duplicates in your dataset, failing to normalize your data, and missing data or N/A data altogether, are some examples of these problems. There are too many of these problems for me to list the solutions to, so you must be mindful of any small errors that the dataset may have that may decrease the accuracy of your model, and search on Google for ways to fix those problems using whatever language you are using.
- Second, you must make sure your data is balanced. This usually means checking that, among the response and explanatory variables you are working with, there is a relatively balanced amount of data points in each category or specific range of values, such that the model is not biased towards one particular category.
- The new data points are usually built off of old data points, so it is important to see if your data is accurate before implementing SMOTE.
- To implement SMOTE in R:
1) Let’s say you have a dataset of people who work specific jobs, with their jobs and the data about their jobs as columns, and you want to build a job recommender model to recommend a person a job based on their desires for their job, using this data.
2) However, there is one problem with the data: the number of people in the dataset is mostly in one job! This would lead to bias towards that one job as more data would be centered around predicting that job. You would need to use SMOTE to oversample the minority jobs, and undersample the majority jobs, so that there is a relatively even number of all jobs in the dataset.
3) To implement SMOTE, you must install the DMwR package, then use this function:

Statology
4) form is the formula you would like to use to compare the explanatory and response variables. It would typically be in this format: y ~ x. y would be the response variable, and x is the explanatory.
5) data is the name of the variable dataset that the .csv file was read as. This will obviously be unique for every data science project as the datasets will all be different.
6) perc.over is the percent by which you want to oversample the majority class, if the majority class is too high. A value of 200 would mean the amount of values in the minority class would be increased by 200%.
7) perc.under is the opposite - it is the percent by which you decrease the amount of appearances of data values in a specific, majority class value, by a ceratin percentage.
You can check if your data is preprocessed well through the accuracy rate of your model, which you can check by dividing your correct predictions or classifications by the total amount of predictions or classifications. Good accuracy rates vary among models, but around 80% is usually considered high and realistic. If your model accuracy is low, poor data preprocessing may be a cause of that, so it is important to preprocess your data thoroughly.
Wrangling
Last but certainly not least, data wrangling is the final step in working with data
before starting to build the main model in your data science project. This involves
transforming your preprocessed data into formats suitable for data analysis. It
doesn’t involve changing the dataset but usually involves making visual
representations of the data you already have. EDA, or exploratory data analysis, is
a commonly used acronym for the process of analyzing data through data
wrangling.
With EDA, a multitude of visual representations of the data will have to be made in
order as all angles of the data you wish to analyze must be viewed in different
contexts in order to reach a solid conclusion. For example, if you were to analyze
an Alzheimer’s dataset for the impact of brain tissue volume on the diagnosis of
Alzheimer’s, you would have to visually represent the relationship between the
different parts of the brain and Alzheimer’s diagnosis. This should be done through
a wide variety of graphs and plots until the best few can be chosen to find a
relationship and to display when presenting your data science project. This process
of data analysis is essentially the basis of wrangling, as it is the purpose of
creating all the visual representations; choosing the best graphs can narrow down
your research to a more specific scope.
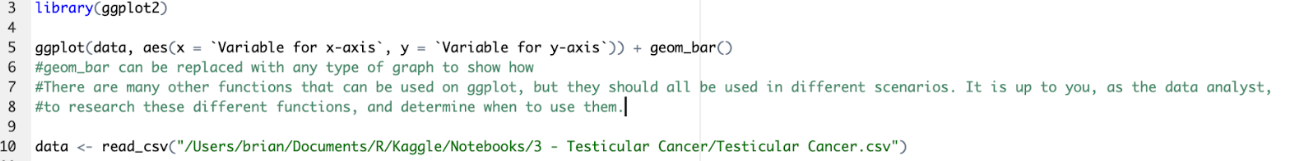
ggplot2 is an effective, commonly used library in R to perform this. With ggplot2,
you can create a variety of visual representations, from single and grouped bar
graphs to box plots.
To use ggplot2:
There are many more intricacies to the full process of working with data, and they
are usually handled by separate, extensive teams. Kaggle, again, is a great place to
look for datasets, and code on EDA, which may help inspire how you work with data in
your next data science project.
This blog stretches past just data science - working with data involves
understanding statistical concepts, which can also help you understand the world
around you better. The world runs on data, and it is presented all the same to
everyone. But only those who view and work with that data in the correct way will be
the ones who gain the most meaningful insight out of it.
I hope that in the data science projects you (hopefully) pursue in the future, you
will use and build on the techniques summarized in this blog. In the next blog, I
will be going over machine learning concepts in depth, and how they can be
implemented in data science projects.